
Maths coursework help?

Everz

FH is my second home
Joined
Nov 7, 2004
Messages
13,685
Stuck on a part of my maths coursework, its about yr 10/11 IQ's and Yr6 SAT results. One of my hypothesis is that i want to compare girls and boy against each other and see whom has the best IQ and KS2, ive done the IQ yet am stumped on what to do for the KS2 results, i have no idea what is best to do to compare them.

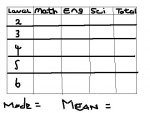
There levels ranging from 2-6

Had an idea of creating a tally, one for boys and another for girls similiar to this one below (attached) and working a mean/median from that, however i have no idea of how to show this and to show which is best. Annoying lol, last hypothesis out of 6 and i cant repeat any methods.
 

Attachments

  • untitled.JPG
    untitled.JPG
    21.6 KB · Views: 42

tris-

Failed Geordie and Parmothief
Joined
Jan 2, 2004
Messages
15,260
wouldnt you need a table like that for girls and boys.

then make a graph showing both sets of data on the same graph then you can compare the lines i suppose.
 

Ezteq

Queen of OT
Joined
Jan 4, 2004
Messages
13,457
sounds good to me but then im no math wizz tbh, might try the mode too which would show if there was any recurring pattern in the scores? i dont know like i say im not great at this but it all sounds fine and practical, any way whatever you do good luck with it :)
 

Everz

FH is my second home
Joined
Nov 7, 2004
Messages
13,685
tris- said:
wouldnt you need a table like that for girls and boys.

then make a graph showing both sets of data on the same graph then you can compare the lines i suppose.
thats what i was thinking.. what time of graph.. scatter?
 

tris-

Failed Geordie and Parmothief
Joined
Jan 2, 2004
Messages
15,260
Eversmallx said:
thats what i was thinking.. what time of graph.. scatter?

at uni we are told only to ever use x,y scatter graphs for jsut about everything.

so im inclined to say yes, then add a best fit line to each set of data.
in excel there should be a tab for the formula when you go into adding a line. choose the R^2 formula to be shown. then change the lines till you get the number that is closest to one. for something like this, i couldnt tell you which it should be.
 

Everz

FH is my second home
Joined
Nov 7, 2004
Messages
13,685
tris- said:
at uni we are told only to ever use x,y scatter graphs for jsut about everything.

so im inclined to say yes, then add a best fit line to each set of data.
in excel there should be a tab for the formula when you go into adding a line. choose the R^2 formula to be shown. then change the lines till you get the number that is closest to one. for something like this, i couldnt tell you which it should be.
so presented like this then.. and from that what next?
 

Attachments

  • =]]]].JPG
    =]]]].JPG
    23.6 KB · Views: 25

tris-

Failed Geordie and Parmothief
Joined
Jan 2, 2004
Messages
15,260
come to think of it that may not be the best representation for that data.

maybe try a bar chart or histogram. or maybe even a pie chart
 

Everz

FH is my second home
Joined
Nov 7, 2004
Messages
13,685
tris- said:
come to think of it that may not be the best representation for that data.

maybe try a bar chart or histogram.
used a histogram, havent used a bar chart for long time.. how would i go about showing this lol?
 

crispy

Can't get enough of FH
Joined
Mar 9, 2004
Messages
2,706
Statistics aint that easy my friend :)

Just because the median for boys and girls are different doesnt mean that its connected to boys being boys and girls being girls :>

Im shit at statistics but theres some kind of way to look at the variance of your numbers and then tell if theres a connection between boys and girls IQ or if its just possible from normal variance of your results ;>

But that wasnt the question :D

And i really dont know what to answer ^_^
 

tris-

Failed Geordie and Parmothief
Joined
Jan 2, 2004
Messages
15,260
well something like this can be used to graphically represent the number of girls and boys who got a certain level in each subject. no idea if its appropriate though :)

first 2 colums maths, second 2 english, last 2 science.

so for example in the first two columns you can look at the yellow lines to compare the numbers of boys and girls who got level 3 in maths.

linking that to the IQ though, couldnt give you a certain answer for that.
 

Everz

FH is my second home
Joined
Nov 7, 2004
Messages
13,685
wow, that would work perfect, am i allowed to use excel produced graphs?
 

tris-

Failed Geordie and Parmothief
Joined
Jan 2, 2004
Messages
15,260
Eversmallx said:
wow, that would work perfect, am i allowed to use excel produced graphs?

i dont know man, ask your teacher/tutor.
though you could draw it i suppose :)
 

Everz

FH is my second home
Joined
Nov 7, 2004
Messages
13,685
tris- said:
i dont know man, ask your teacher/tutor.
though you could draw it i suppose :)
will do, ive already done the IQ, im not looking to find a link between the two, just to show in 2 ways of which have the higher IQ/better Ks2 results. i used stem leaf for the IQ and then found mean/median and compared (no graph.. should i use one?)
 

tris-

Failed Geordie and Parmothief
Joined
Jan 2, 2004
Messages
15,260
Eversmallx said:
(no graph.. should i use one?)

wouldnt want to answer that. graph is good really just to show numbers visually, seen as most humans can look at a picture better than a group of numbers.
 

Ballard

Fledgling Freddie
Joined
Oct 6, 2004
Messages
1,711
tris- said:
wouldnt want to answer that. graph is good really just to show numbers visually, seen as most humans can look at a picture better than a group of numbers.

Given the limited sample size you should calculate the standard error of the distribution. (Takes into account the standard deviation adjusted for the survey population size). Any difference between the subsets of data can then be compared to determine whether the resulting difference is statistically significant (i.e. is your result attributable to normal variance or is it an actual subset trend).

Your textbook should explain these steps.
 

Succi

Fledgling Freddie
Joined
Jan 24, 2004
Messages
1,266
standard deviation is always king when analysing statistics :F
 

Everz

FH is my second home
Joined
Nov 7, 2004
Messages
13,685
Succi said:
standard deviation is always king when analysing statistics :F
saving that for stats coursework
 

Bugz

Fledgling Freddie
Joined
May 18, 2004
Messages
7,297
If you want to look at IQ/Total then use spearman's rank. The moderator will love it.

That seems the most logical answer.

By the way, if that isn't stats coursework then wtf is it? My pure maths coursework was a patchwork quilt/ matchsticks investigation which had no relevence at all to statistics...
 

Users who are viewing this thread

Top Bottom